Acid–Base Titration: Apparatus, Curve and Equivalence Point Explained
Understand the titration setup, the difference between endpoint and equivalence point, and what each region of a titration curve means.
Quick answer
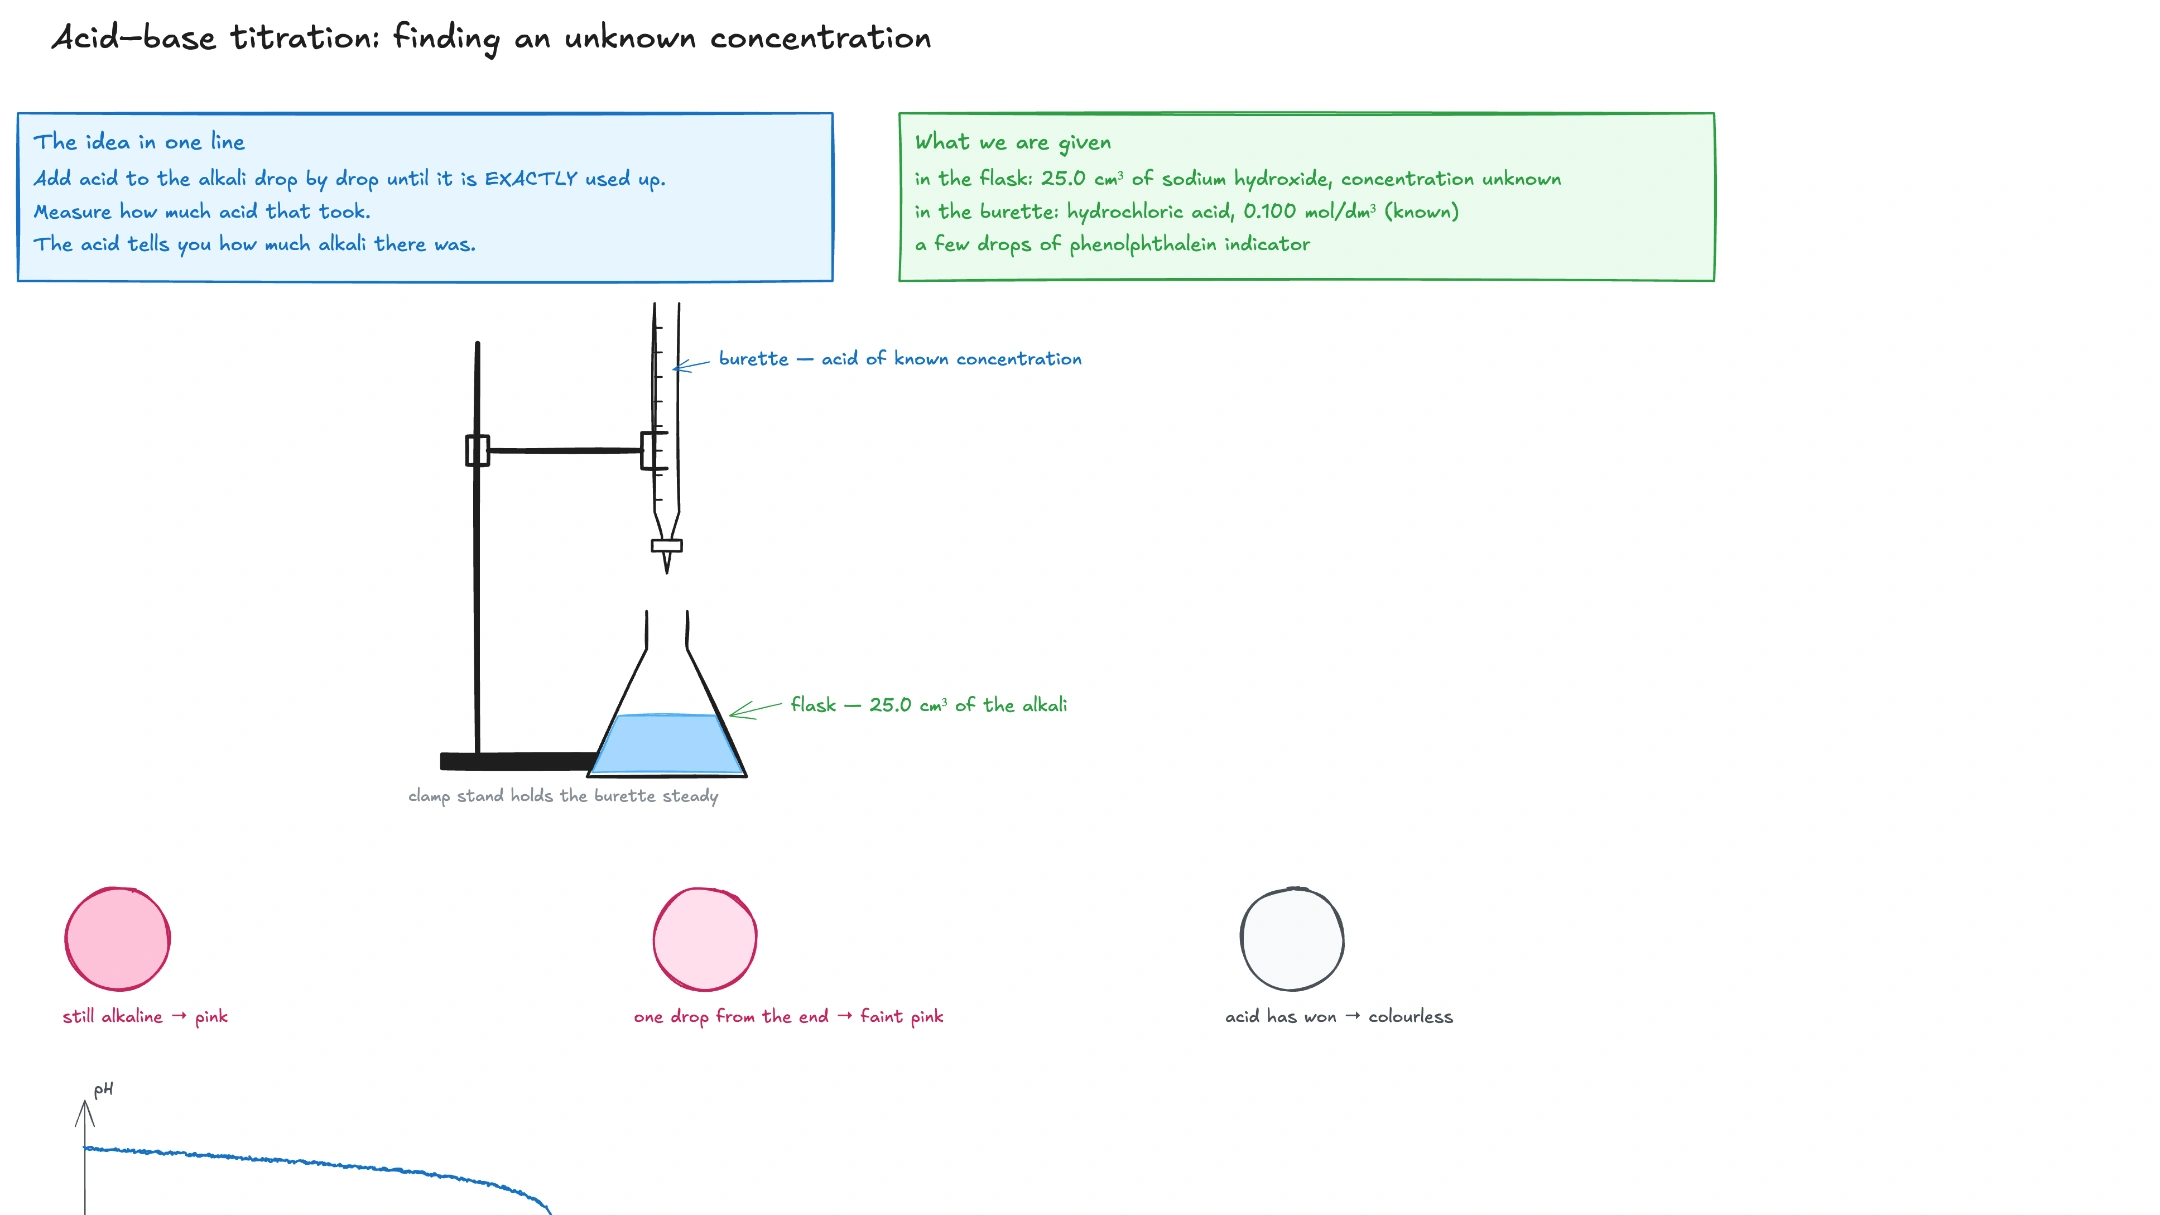
An acid–base titration uses a solution of known concentration in a burette to determine an unknown concentration in a flask. The equivalence point occurs when acid and base have reacted in the stoichiometric ratio; the indicator endpoint is the observed color change used to estimate it.
Key relationships
Read the apparatus as a measurement system
The burette contains the titrant, whose concentration is known. A pipette transfers a precise volume of the unknown analyte into the conical flask. The titrant is added while the flask is mixed, and the burette readings reveal the delivered volume.
Near the expected endpoint, titrant is added drop by drop because a small added volume can cause a large pH change. Rinsing glassware with the correct solution and reading the meniscus at eye level reduce avoidable measurement error.
Follow the titration curve from left to right
Before much titrant is added, the analyte controls the pH. A buffer region appears in a weak-acid or weak-base titration where a species and its conjugate are both present. The steep section surrounds equivalence, where the limiting reagent changes.
After equivalence, excess titrant controls the pH. The equivalence pH is approximately 7 for a strong acid–strong base titration at room temperature, above 7 for weak acid–strong base, and below 7 for strong acid–weak base.
Separate endpoint from equivalence point
The equivalence point is theoretical: reactants are present in the stoichiometric amounts required by the balanced equation. The endpoint is experimental: the indicator changes color. A well-chosen indicator makes those two volumes close, but they are not identical definitions.
To calculate an unknown concentration, convert the measured titrant volume to moles, use the balanced-equation ratio, and divide the analyte moles by its original volume.
What to remember
- The burette delivers a measured volume of titrant into the analyte.
- Equivalence point is a stoichiometric condition, not simply pH 7 in every titration.
- The indicator should change color within the steep region near equivalence.
- The curve's shape depends on acid and base strength.
Frequently asked questions
Is the equivalence point always pH 7?
No. It is near pH 7 for strong acid–strong base titrations, but weak-acid and weak-base systems shift the equivalence pH.
Why use a conical flask instead of a beaker?
Its narrow neck allows vigorous swirling with less risk of splashing or losing solution.
Why repeat a titration?
Concordant repeated titres reduce the influence of random reading and endpoint errors.
Watch a titration apparatus and curve get drawn
Play the complete lesson free—drawn and narrated from start to finish, with no account needed.